 Department for Culture, Media and Sport
The National Data Strategy is working to unlock the power of data for the UK, and ensure its impacts are felt by everyone, everywhere.
Last month, we published an anniversary update celebrating 12 months since its original publication and highlighting everything we’ve done to make that vision a reality.
As a team we’re focussed on implementation and ensuring we deliver into the future, and so we recently set out our approach to monitoring and evaluation, and launched a call for evidence on metrics for the National Data Strategy indicator suite.
Monitoring and evaluation framework
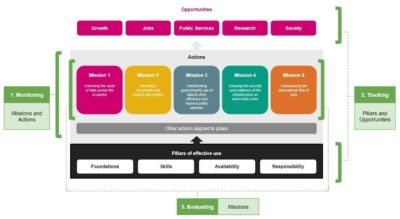
The National Data Strategy monitoring and evaluation framework has three aspects:
- Monitoring our missions and the actions to measure progress
- Tracking the data opportunities and pillars of effective data use to track the UK’s data ecosystem
- Evaluating the effectiveness of the five missions
The guiding principles for the framework are that it is:
- dynamic and forward looking;
- outcome-oriented; and
- proportionate.
In this way, the framework can act as a solid foundation for implementing the strategy, with the flexibility to react to new challenges as these arise (which is more than likely in the world of data and technology!).
Tracking through an indicator suite
A big part of that foundation for the future is the indicator suite which we want to develop to support our tracking of the UK data ecosystem.
As we developed the monitoring and evaluation framework, we kept coming up against the difficulties of measuring the impact of data. This is a new and fascinating field, but still in its relative infancy, with a host of unique challenges. How do you measure something so intangible, which is often only apparent in its application? How can you track something so huge, which cuts across almost everything that society does? And how do you do that all in a manageable way?
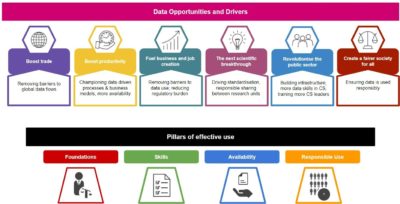
We therefore came up with the idea of initially tackling this by creating a high-level suite of indicators, based on the National Data Strategy pillars of effective data use and opportunities.
The idea is to have a defined set of metrics for each pillar and opportunity, which we can measure over time and use to gauge the health of the UK’s data ecosystem.
Call for evidence on metrics
However, as our research progressed, we found it difficult to identify solid metrics that actually told us what we wanted to know about data in a holistic sense.
That’s why we decided to also launch a call for evidence on metrics for the indicator suite.
We know there is so much great work going on in the wider data ecosystem. Lots of organisations are thinking about these sorts of problems when it comes to data and measurement. We want to use this exercise to bring that thinking into a central place, and identify metrics which can give us insight into some of the key issues surrounding data use, including:
- how data is working across the private, public and third sectors
- how data impacts on diverse or underrepresented groups
- how data use breaks down at a regional level within the UK
- how international factors may influence the pillars or opportunities
- how the UK’s position on data use compares in a global context
How to get involved
If you’d like to get involved in this project, it’d be great to hear from you.
Please take some time to read the full description of the indicator suite’s development to date. Then, let us know your thoughts on potential metrics by responding to the call for evidence before it closes on 3rd December 2021.