 Department for Culture, Media and Sport
DCMS covers a wide range of policy areas – from access to theatre to mobile phone coverage, from sports participation to digital skills. It follows then, that DCMS’s policies have the potential to influence a large section of the British economy. But how much exactly?
This was a question analysts in DCMS set about answering earlier this year. Working with the Office for National Statistics, we developed methods to measure the contribution of DCMS sectors to the economy, consistently building on previous approaches so they could be combined into an overall estimate. These new statistics measure gross value added (GVA)GVA is the measure of the value of goods and services produced in an area, industry or sector of an economy. It is nominal, meaning it has not be adjusted for inflation. It is related to GDP as such: GVA + taxes on products – subsidies on products = GDP, employment and trade across all DCMS’s sectors in a consistent manner.
We divided the sectors up into seven broad groups – the Digital Sector, the Creative Industries, Culture, Gambling, Sport, Telecoms and Tourism. These contained all our related industries, from library and archive activities to the publishing of computer games. Unfortunately, the current estimates do not account for the machinery of government change which led to the the Office for Civil Society moving to DCMS as it was too late in the process to make changes to the estimates – but work is being done on including it in future.
As expected from any department with so many synergies between its sectors, there is a lot of overlap between them. For example, all of Telecoms is defined as being in the Digital Sector too, and many industries in Digital are also considered Creative.
Once we had our sectors defined, we used the data from the UK’s National Accounts, Annual Population Survey (APS), the Annual Business Survey (ABS), and the International Trade in Services survey (ITIS), to measure their economic size over the years.
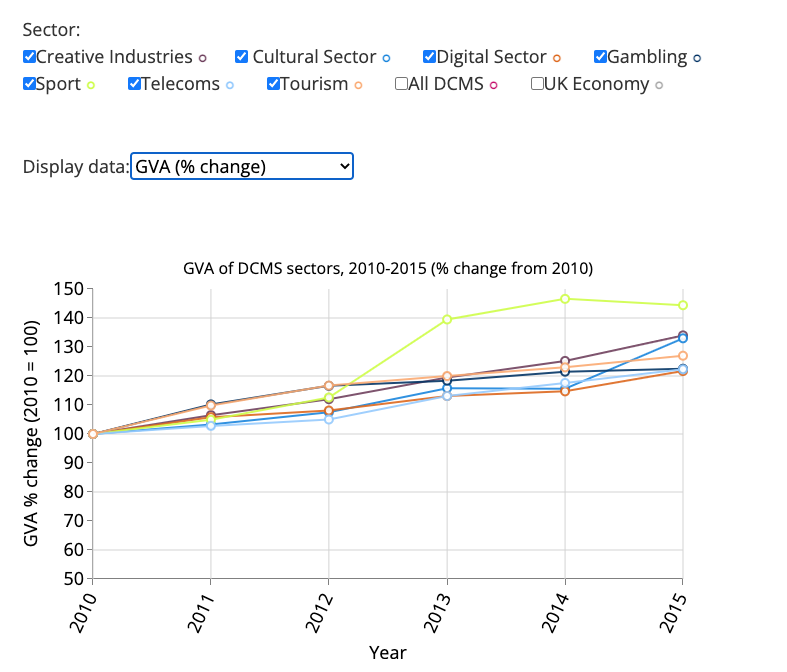
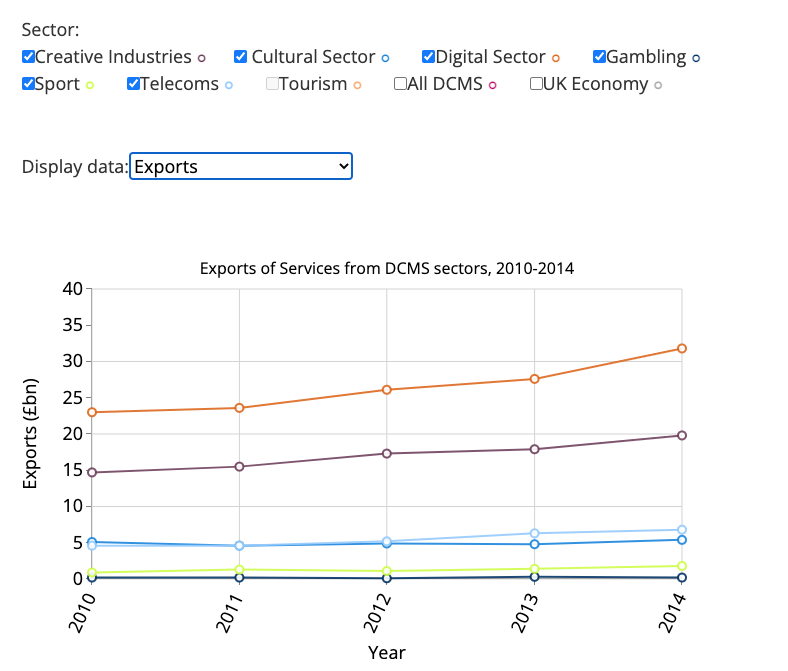
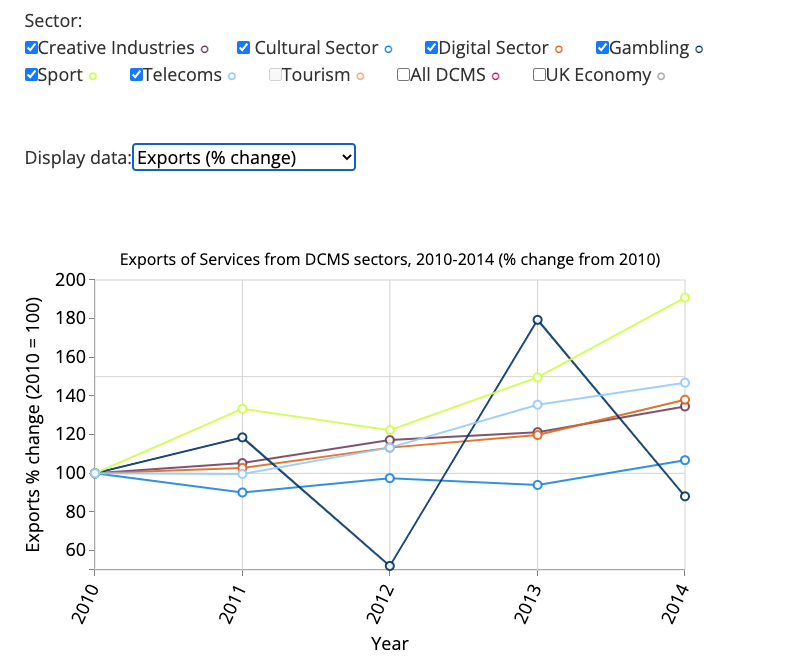
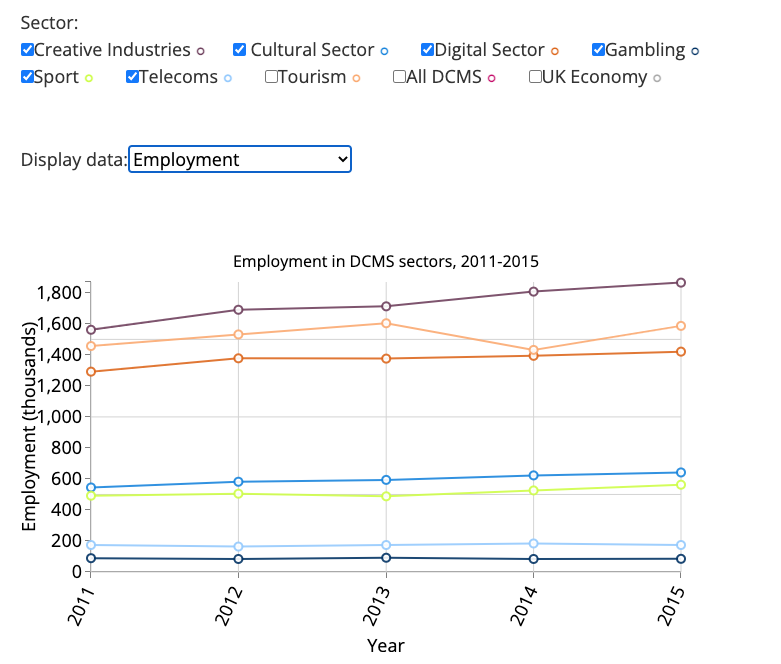
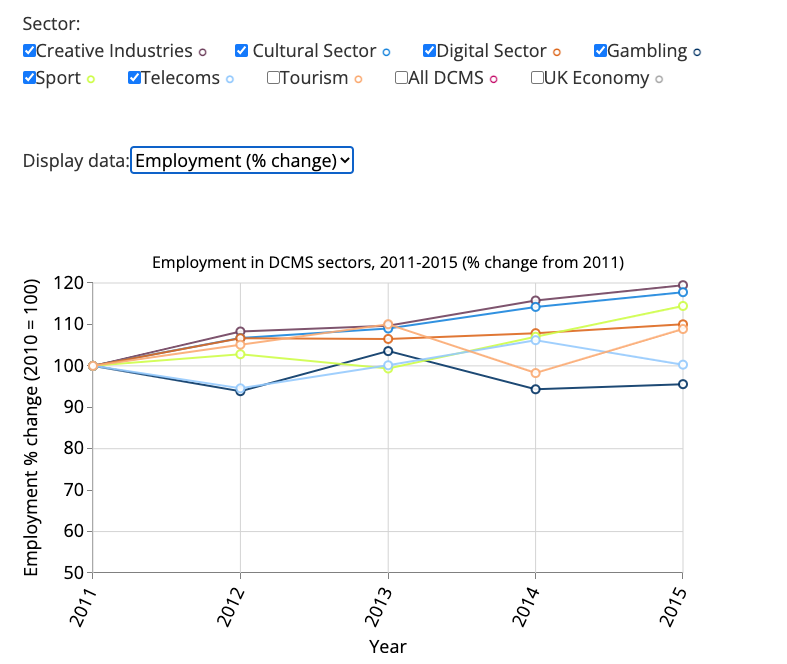
And what did we find out? For every £10 added to the UK economy, more than £1.30 comes from DCMS’s sectors – on average that’s £25 million an hour. For every 1,000 jobs in the country, at least 137 are in our sectors. They account for more than £1 in every £6 of services exported from the UK. But what about each of the sectors themselves?
This interactive chart lets you explore how each of DCMS’s sectors contributes to the economy, in the form of GVA, employmentThis is a measure of the number of jobs, not the number of employed people. This includes both employed and self-employed jobs, and first and second jobs and exports in servicesThis is the exports of any service, and does not include any physical goods. They show both absolute values, as well as the values indexed at 100 in 2010. If you have any questions or feedback, you can get in touch with us at evidence@culture.gov.uk. You can find the source code for the visualisation here.
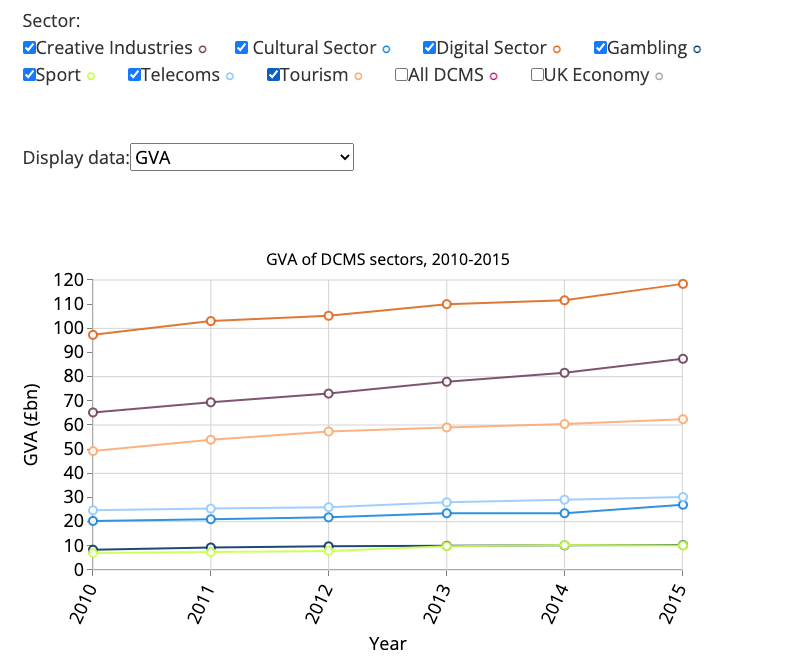
Source: DCMS Sectors Economic Estimates